Human Resources Data Dashboard
The Henderson ISD Human Resources tracks certain data in order to provide district staff information to support their efforts in teaching and learning, employee recruitment and retention, and employee safety.
Data collection for the beginning of each school year starts on July 1 and ends June 30th.

February Campus Staff Absence Data
Updated Weekly
(Data as of 2/28/25)
Campus | Number of Absences | School Business/Jury Duty Days | Absences Needing Sub | Sub Fill Rate |
|---|---|---|---|---|
Primary | 121 | 21 | 104 | 73% |
Elementary | 185 | 24.5 | 117 | 39% |
Northside | 95 | 39 | 75 | 93% |
Middle School | 154 | 36.5 | 109 | 73% |
High School | 267 | 124.5 | 178 | 59% |
MAC | 22 | 0 | 14 | 86% |
Data includes pending/upcoming absences reported in Frontline.
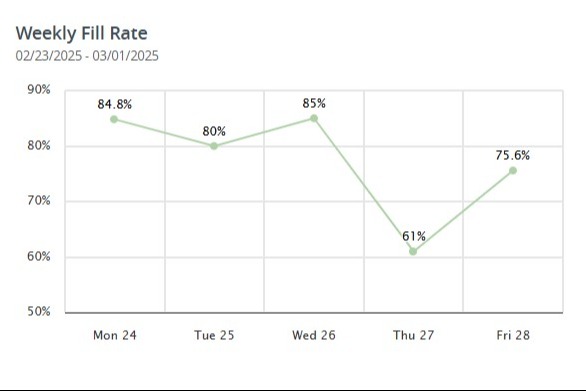
Weekly Absence Charts
Updated Weekly
(Data as of 2/28/25)
Campus Staff Absence Data
Updated Weekly
(Data as of 2/28/25)
Month (# of Work Days) | Primary 58 Staff # Staff Absences % Absence Rate | Elementary 79 Staff # Staff Absences % Absence Rate | Northside 62 Staff # Staff Absences % Absence Rate | Middle School 83 Staff # Staff Absences % Absence Rate | High School 121 Staff # Staff Absences % Absence Rate | MAC 9 Staff # Staff Absences % Absence Rate |
|---|---|---|---|---|---|---|
July (21) | 13 | 5 | 1 | 11 | 22 | 0 |
August (22) | 47/96.2% | 65/96.2% | 40/97.1% | 60/96.7% | 89/96.6% | 5/97.5% |
September(20) | 71/93.7% | 141/91.0% | 74/94.0% | 128/92.3% | 193/91.9% | 16/91.1% |
October (18) | 60/94.0% | 126/91.0% | 61/94.5% | 139/90.7% | 174/91.9% | 8/95.1% |
November(16) | 71/92.9% | 109/91.3% | 98/90.1% | 157/88.2% | 191/90.0% | 5/96.5% |
December(15) | 49/94.2% | 79/93.2% | 90/90.3% | 148/88.1% | 151/91.5% | 8/94.1% |
January (20) | 126/88.8% | 143/90.8% | 135/89.1% | 183/89.0% | 244/89.2% | 18/90.0% |
February (19) | 121/88.6% | 185/87.5% | 95/91.9% | 154/90.2% | 267/88.2% | 22/87.1% |
March (16) | ||||||
April (21) | ||||||
May (21) | ||||||
June (20) | ||||||
Total Absences | ||||||
Current Absence Rate | 545/83.8% | 848/81.9% | 593/84.1% | 969/80.5% | 1329/81.4% | 82/84.8% |
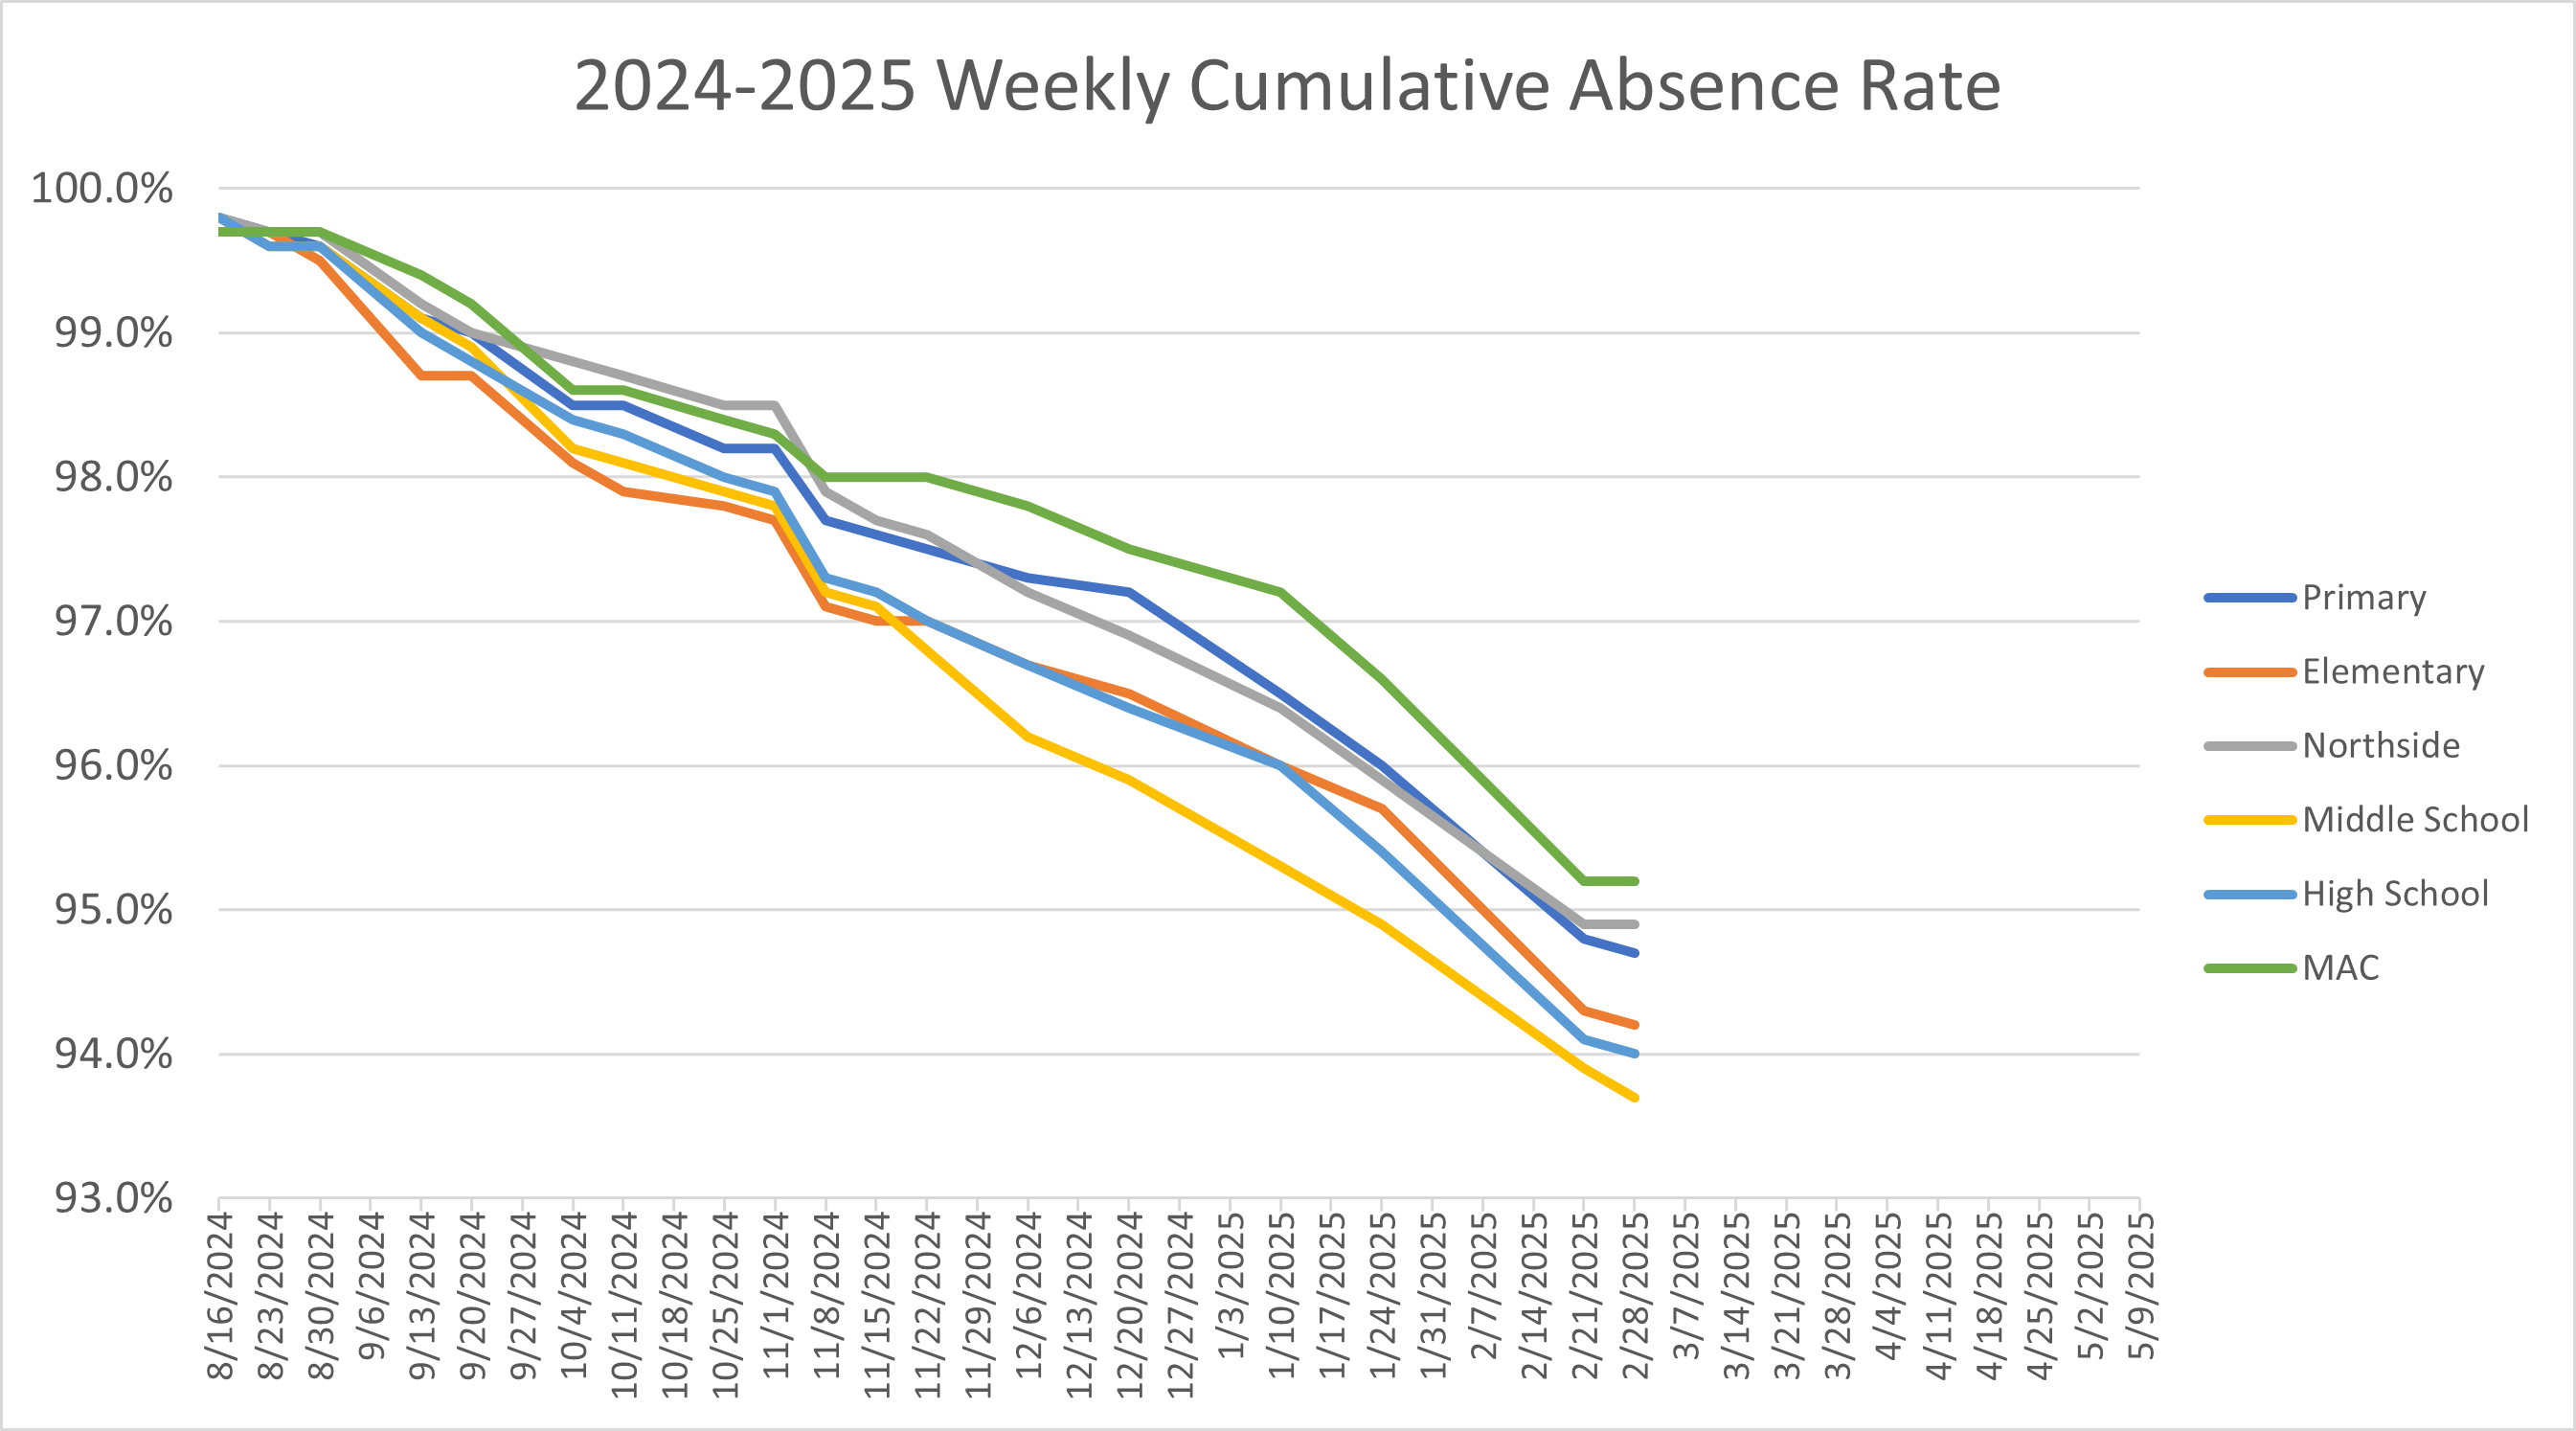
Cumulative Absence Rate | 94.7% | 94.2% | 94.9% | 93.7% | 94.0% | 95.2% |
Data includes pending/upcoming absences reported in Frontline. School business and jury duty days are included.
Absence Rate calculated starts August 1st and ends May 24th. Absence Rate = 100% - ( # of total absences / (# of staff x # of workdays) )
District Position Fill Rates
Updated Weekly
(Data as of 2/28/25)
Position Type | % Filled |
Teachers | 99% |
Professional Support | 99% |
At-Will Support | 99.5% |
Number of District Positions per Campus/Department
Updated Weekly
(Data as of 2/28/25)
*currently, 18 employees serve in dual positions
Primary | 57 |
|---|---|
Elementary | 77 |
Northside | 63 |
Middle School | 86 |
High School | 118 |
MAC | 10 |
SPED | 18.5 |
Central Office | 32.5 |
Transportation | 46 |
Maintenance | 16 |
Child Nutrition | 48 |
Paid Teacher Interns | 1 |
Total District Staff | 573 |
Current Substitutes | 96 |
Weekly Cumulative Absence Rate
Updated Weekly
(Data as of 2/28/25)
Number of Days Since Last Report of Employee Injury
Updated Weekly
(Data as of 2/28/25)
(Info Only Reports not included)
Campus/Department (# of Injuries) | # of Days Since Last Report of Injury |
Primary (1) | 81 |
Elementary(1) | 32 |
Northside | 220 |
Middle School | 220 |
High School (3) | 29 |
MAC(1) | 80 |
Central Office | 220 |
Maintenance | 220 |
Transportation (1) | 138 |
Athletics | 220 |
Child Nutrition(3) | 43 |
Monthly Comparison of Absences on Campuses
Updated Monthly
(Data as of 2/28/2025)
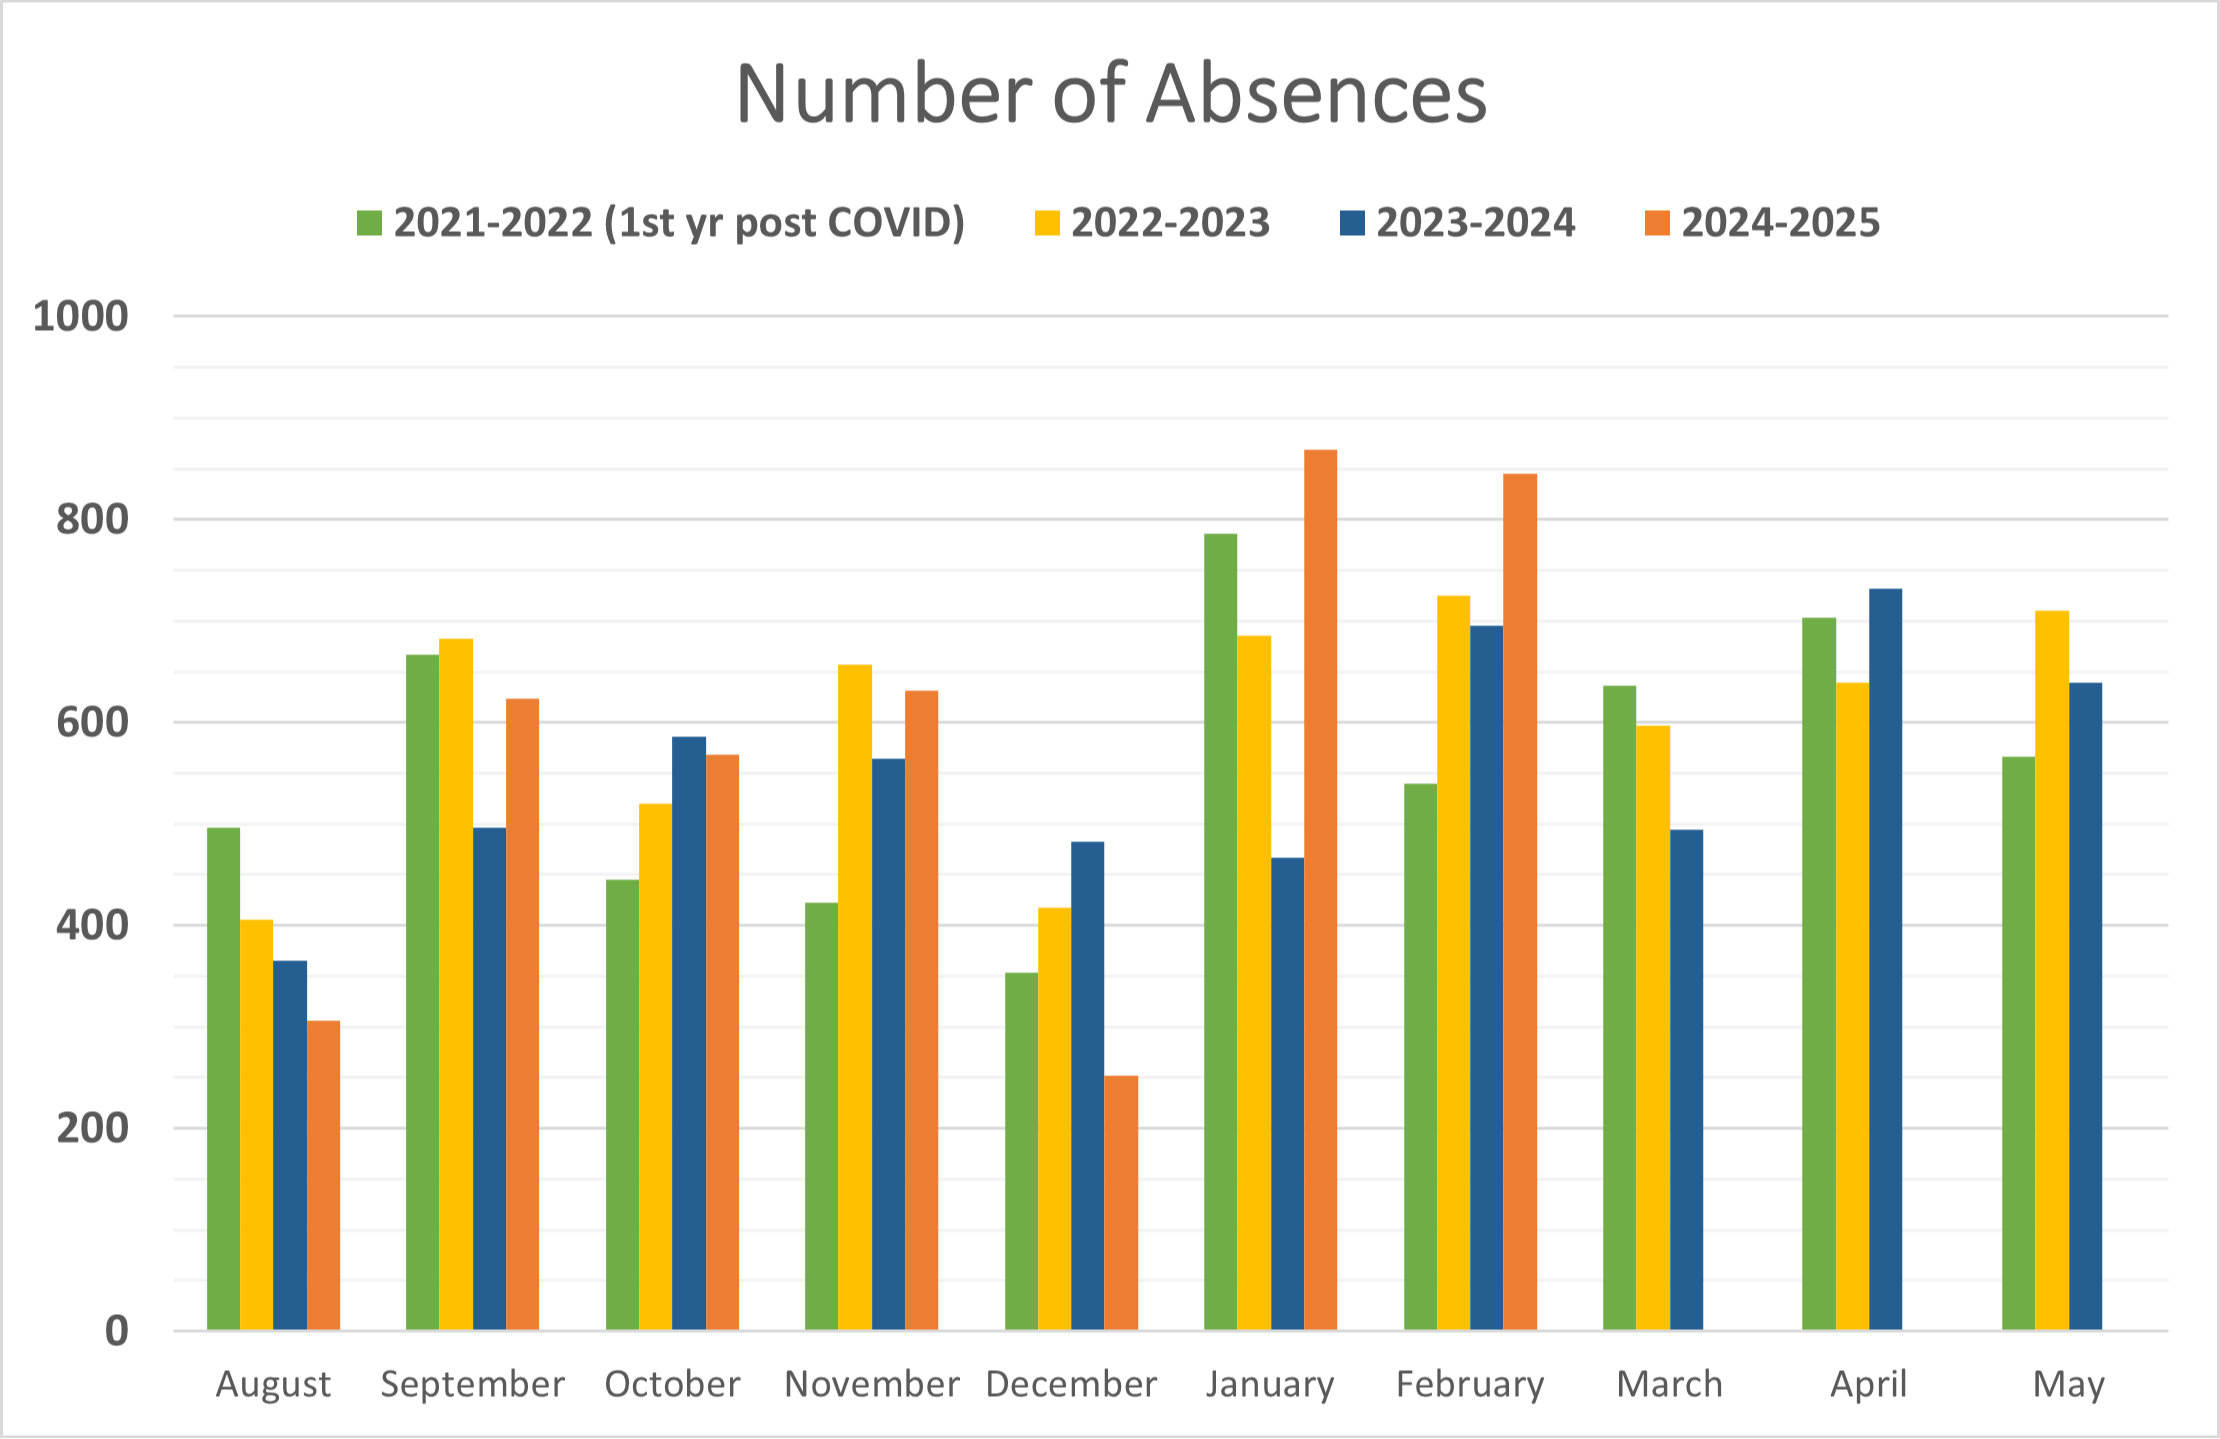
Data includes School Business and Jury Duty Days